
Introduction
The goal of this project is to analyze viewership and IMDB ratings for the cult classic TV series “Buffy the Vampire Slayer” using SQL and Excel. It leverages 20+ complex SQL queries, including subqueries and window functions, to analyze trends in ratings, viewership, and engagement. By examining these ratings, I aim to uncover trends, patterns, and insights into the show’s reception over its seven-season run.
“Buffy the Vampire Slayer” is a television series that aired from 1997 to 2003. Created by Joss Whedon, the show follows Buffy Summers (played by Sarah Michelle Gellar), a teenage girl chosen by fate to battle against vampires, demons, and other supernatural forces. Set in the fictional town of Sunnydale, California, Buffy balances her responsibilities as the Slayer with the challenges of high school and young adulthood.
Analyzing viewership and IMDB ratings for a show like “Buffy the Vampire Slayer” provides quantitative insights into the show’s reception, allowing us to understand how audiences responded to different episodes, seasons, and story arcs.
This analysis can reveal patterns in viewer engagement, helping to identify what elements of the show resonated most with its audience. For the television industry, such insights are valuable for informing future content creation and programming decisions.
By combining data analytics with cultural studies, we can gain a more comprehensive understanding of how and why certain television series become influential and stand the test of time.
Table of Contents
Tools and Data Sources
Technologies Used
- Microsoft Excel
- Used for data cleaning and transformation
- Used for creating preliminary charts and graphs
- SQL (PostgreSQL)
- Chosen as the relational database management system for storing and querying the dataset
- Used for initial data exploration, basic statistical analysis, and complex queries
- Leveraged for performing advanced analytical functions and window operations
Data Sources
The data for this project was collected from the following sources:
- IMDb (Internet Movie Database)
- Episode (user) ratings and vote counts
- Ratings are on a scale of 0 to 10, which is standard for IMDB ratings. 10 is the best, and 0 is the worst.
- Buffy the Vampire Slayer Wikipedia Page
- Episode titles
- Writer and director information
- Season and episode numbers
- U.S. viewer numbers for each episode
Methodology
- Data Collection: Gathered U.S. viewer ratings from Wikipedia and IMDB scores for all episodes.
- Data Cleaning: Used Excel to clean and preprocess the data.
- Exploratory Data Analysis: Utilized SQL for initial data exploration and basic statistical analysis.
- Visualization: Created charts and graphs using Excel.
Database Structure
The data for this project is organized into the following tables in my PostgreSQL database:
Tables
episodes
- episodeid (INTEGER, PRIMARY KEY): Unique identifier for each episode.
- season (INTEGER): Season number.
- episode_number (INTEGER): Episode number within the season.
- air_date (DATE): Date the episode aired
- title (VARCHAR): Episode title.
- director (VARCHAR): the episode’s director
writers
- writerid (INTEGER, PRIMARY KEY): Unique identifier for each writer.
- writer_name (VARCHAR): Name of the writer.
writers_episodes
- episodeid (INTEGER, FOREIGN KEY REFERENCES episodes(episodeid)): References the episodes table.
- writerid (INTEGER, FOREIGN KEY REFERENCES writers(writerid)): References the writers table.
ratings
- rating_id (PRIMARY KEY)
- episodeid (INTEGER, FOREIGN KEY REFERENCES episodes(episodeid)): References the episodes table.
- imdb_rating (NUMERIC): IMDb rating for the episode.
- imdb_votes (NUMERIC): number of people who rated the episode
- viewers (NUMERIC): Number of US viewers (in millions)
Relationships
- The episodes table is the central table, connected to the ratings and writers_episodes tables through the episodeid column. It contains core imformation about each episode
- The writers table lists all the writers for every episode.
- The writers_episodes table acts as a junction table, connecting the episodes and writers tables. It allows us to track which writers wrote which episodes.
- The ratings table contains detailed rating information from IMDB and Wikipedia.
Data Types
- INTEGER: Used for numerical values like episode IDs, season numbers, and episode numbers.
- VARCHAR: Used for text-based values like episode titles and writer names.
- NUMERIC: Used for storing IMDb ratings and viewership numbers, which have decimal places.
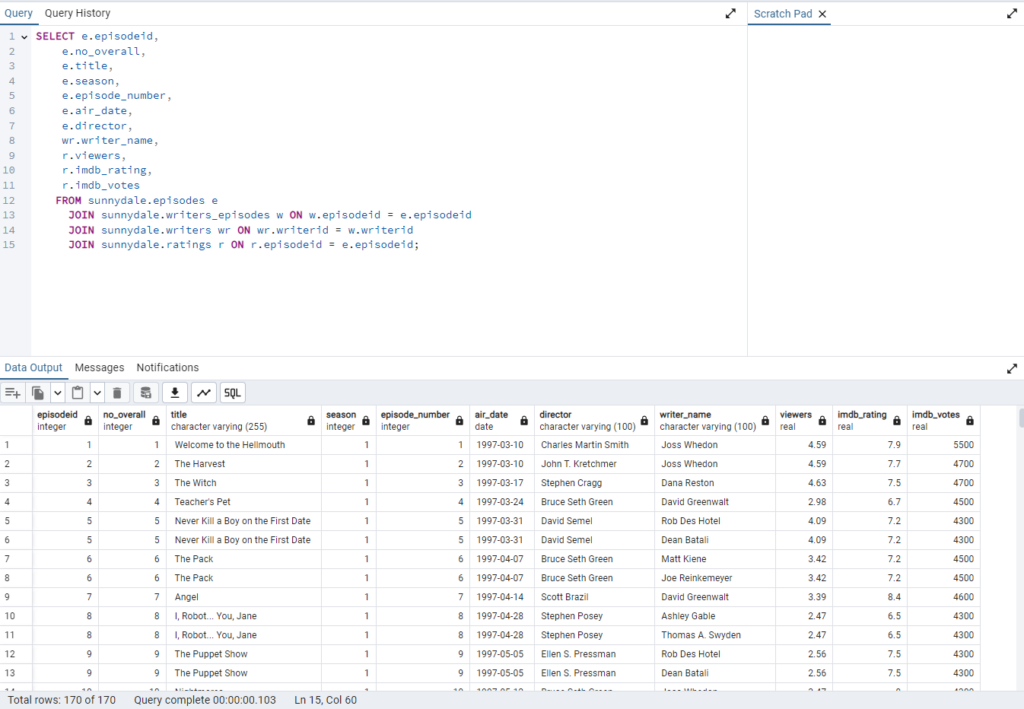
A Joined Table that connects all the four tables in the database.
SQL Queries
Here are the SQL queries that were used in the data analysis process:
Part I: Exploratory Data & Episode Analysis
Question 1: Calculate the average IMDb rating for all episodes
This SQL query calculates and displays the average IMDb rating across all episodes in the dataset. This simple yet informative analysis provides a quick overview of the general quality of episodes as perceived by IMDb users. The result offers a baseline metric that can be used for comparison with individual episode ratings or ratings of specific seasons or shows.
SELECT
	ROUND(AVG(imdb_rating),2) as avg_rating
FROM sunnydale.ratings
Explanation:
AVG(imdb_rating): Calculates the average IMDb rating for all episodes in theratingstable.round(..., 2): Rounds the numeric value to two decimal places.
Result

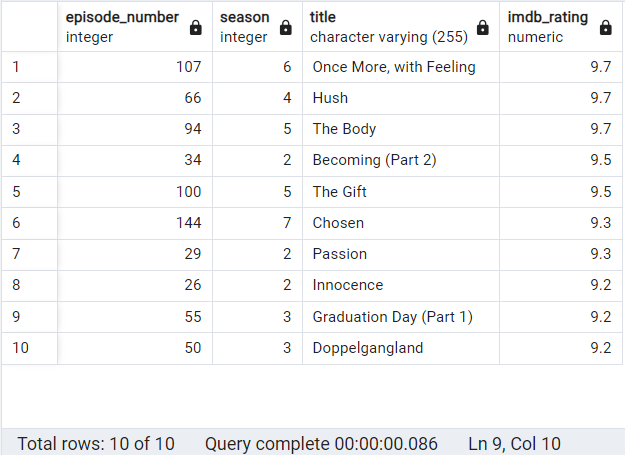
Question 2: Find the top 10 highest-rated episodes
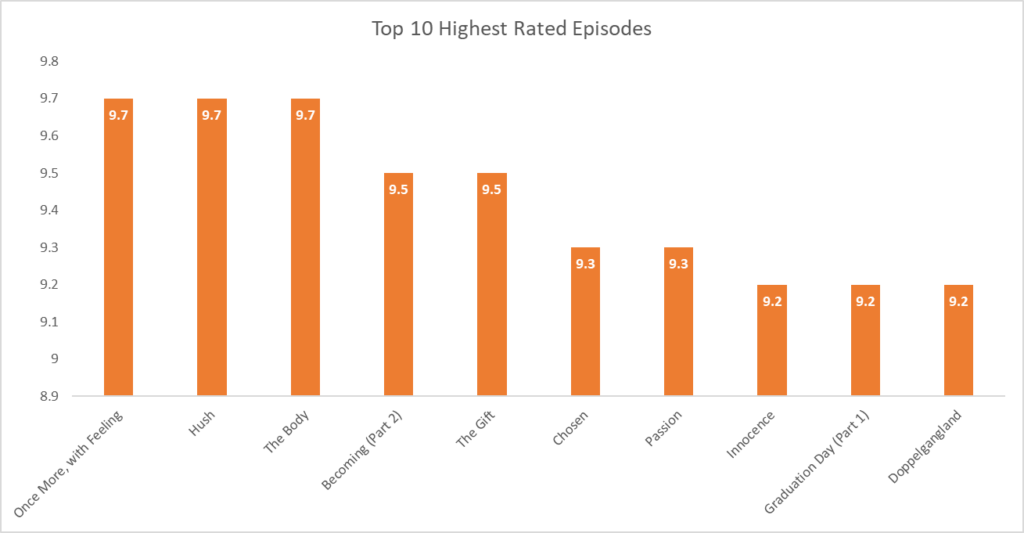
This SQL query identifies and lists the ten episodes with the highest IMDb ratings in the dataset. It provides a quick overview of the most well-received episodes according to IMDb users. This helps to identify peak moments of quality or popularity across the episodes in the show.
SELECT
  e.no_overall as episode_number,
	e.season,
	e.title,
	r.imdb_rating
FROM sunnydale.episodes e
INNER JOIN sunnydale.ratings r ON e.episodeid = r.episodeid
ORDER BY r.imdb_rating DESC
LIMIT 10;
Explanation:
INNER JOIN: I joined theepisodesandratingstables on theepisodeidcolumn to combine episode information with their corresponding ratings.ORDER BY: TheORDER BY r.imdb_rating DESCclause sorts the results in descending order based on theimdb_rating.LIMIT: TheLIMIT 10clause restricts the result set to the top 10 episodes with the highest ratings.
Result
Question 3: Find the top 10 lowest-rated episodes
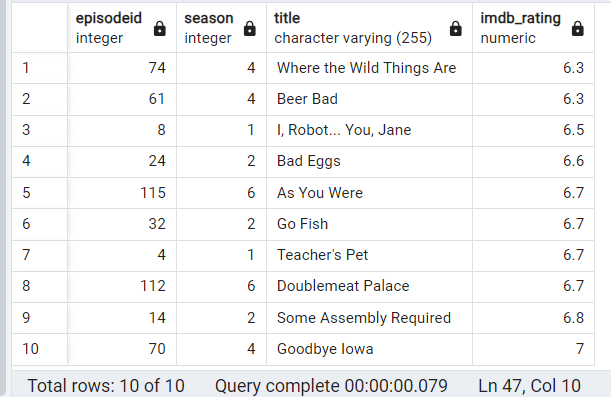
This SQL query identifies and displays the ten episodes with the lowest IMDb ratings in the dataset. It offers a glimpse into the least popular or critically acclaimed episodes according to IMDb users. This provides insight into some of the show’s potential weak points.
SELECT
    e.episodeid, e.season, e.title, r.imdb_rating
FROM sunnydale.episodes e
INNER JOIN sunnydale.ratings r ON e.episodeid = r.episodeid
ORDER BY r.imdb_rating ASC
LIMIT 10;
Explanation:
INNER JOIN: I joined theepisodesandratingstables on theepisodeidcolumn to combine episode information with their corresponding ratings.ORDER BY: TheORDER BY r.imdb_rating ASCclause sorts the results in ascending order based on theimdb_ratingcolumn from theratingstableLIMIT: Restricts the result set to the bottom 10 episodes with the lowest IMDb ratings.
Result
Question 4: Analyze the distribution of ratings
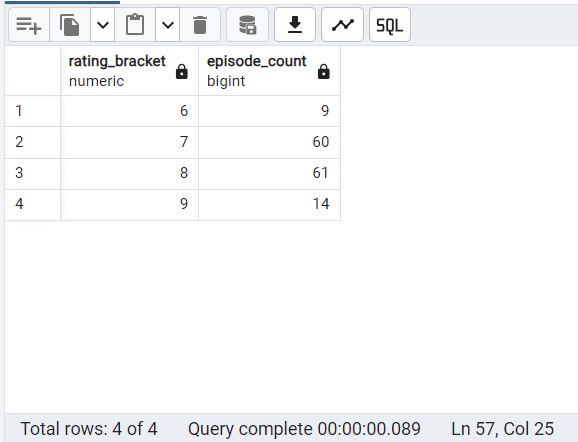
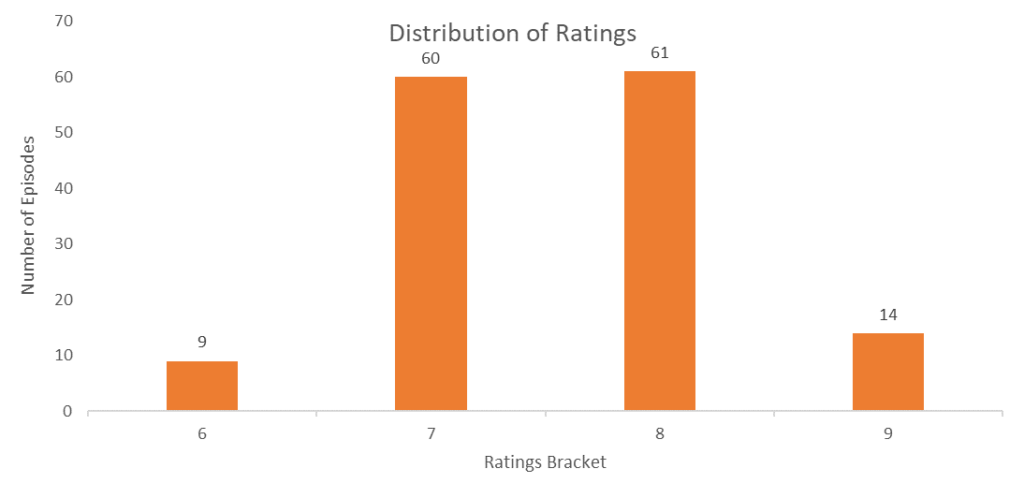
This SQL query analyzes the distribution of IMDb ratings for episodes in the “Buffy the Vampire Slayer” dataset. It groups episodes by their rounded IMDb rating (to the nearest integer) and counts how many episodes fall into each rating bracket. The results offer a clear picture of the overall quality perception of the show’s episodes, highlighting which rating ranges are most common.
SELECT
	FLOOR(r.imdb_rating) as rating_bracket,
	COUNT(*) as episode_count
FROM sunnydale.episodes e
INNER JOIN sunnydale.ratings r ON e.episodeid = r.episodeid
GROUP BY FLOOR(r.imdb_rating)
ORDER BY rating_bracket;
Explanation
FLOOR(r.imdb_rating) as rating_bracket: Rounds the IMDb rating down to the nearest integer and assigns it to the aliasrating_bracket.COUNT(*) as episode_count: Counts the number of episodes in each rating bracket.GROUP BY: Groups the results byFLOOR(r.imdb_rating)to count the number of episodes in each rating bracket.ORDER BY rating_bracket: Orders the results by the rating bracket to present the data in a clear and organized manner.
Result
Key Findings:
- Rating Distribution:
- The most common rating bracket is 8, with 61 episodes.
- The least common rating bracket is 6, with only 9 episodes.
- The majority of episodes fall within the 7-8 rating range, indicating a generally positive reception.
- Outliers:
- The rating brackets of 6 and 9 represent outliers, with significantly fewer episodes compared to the 7 and 8 brackets.
Conclusion:
- The episodes’ IMDb ratings are skewed towards higher ratings, with a majority of episodes falling within the 7-8 range. This suggests that the show generally receives positive reviews.
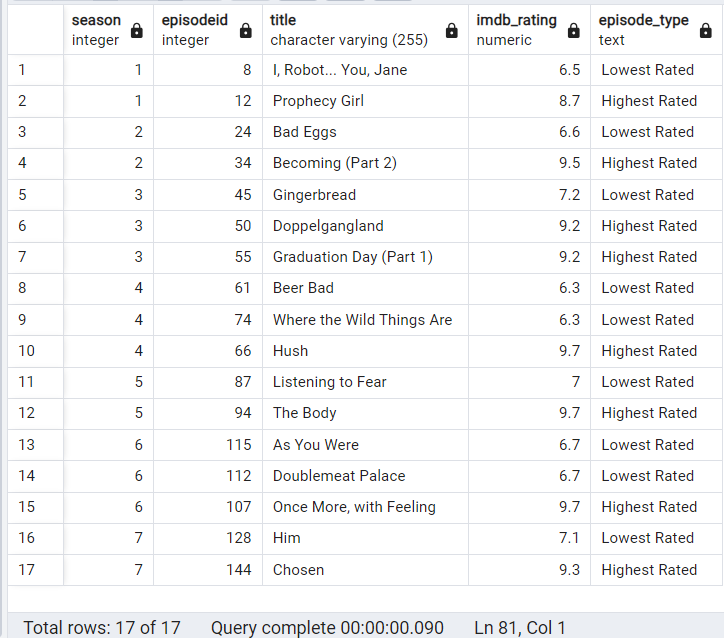
Question 5: Find the Highest and Lowest Rated Episodes per Season
This SQL query identifies the highest and lowest rated episodes for each season of the show. The query will return the season, episode ID, IMDb rating, and a label indicating whether the episode is the highest or lowest rated within its season.
WITH ranked_episodes AS (
    SELECT
        e.season,
		e.title,
        e.episodeid,
        r.imdb_rating,
        RANK() OVER (PARTITION BY e.season ORDER BY r.imdb_rating DESC) AS highest_rank,
        RANK() OVER (PARTITION BY e.season ORDER BY r.imdb_rating ASC) AS lowest_rank
    FROM sunnydale.episodes e
    INNER JOIN sunnydale.ratings r ON e.episodeid = r.episodeid
)
SELECT
    season,
    episodeid,
	title,
    imdb_rating,
    CASE WHEN highest_rank = 1 THEN 'Highest Rated'
         WHEN lowest_rank = 1 THEN 'Lowest Rated'
         ELSE 'Other' END AS episode_type
FROM ranked_episodes
WHERE highest_rank = 1 OR lowest_rank = 1;
Explanation:
- Common Table Expression (CTE):
ranked_episodesRANK() OVER (PARTITION BY e.season ORDER BY r.imdb_rating DESC) AS highest_rank- Ranks episodes within each season by IMDb rating in descending order.
RANK() OVER (PARTITION BY e.season ORDER BY r.imdb_rating ASC) AS lowest_rank- Ranks episodes within each season by IMDb rating both in ascending order.
- Main Query
- Selects episodes with the highest or lowest rank within their season.
- Uses a
CASEexpression to label episodes as “Highest Rated,” “Lowest Rated,” or “Other.”
Result
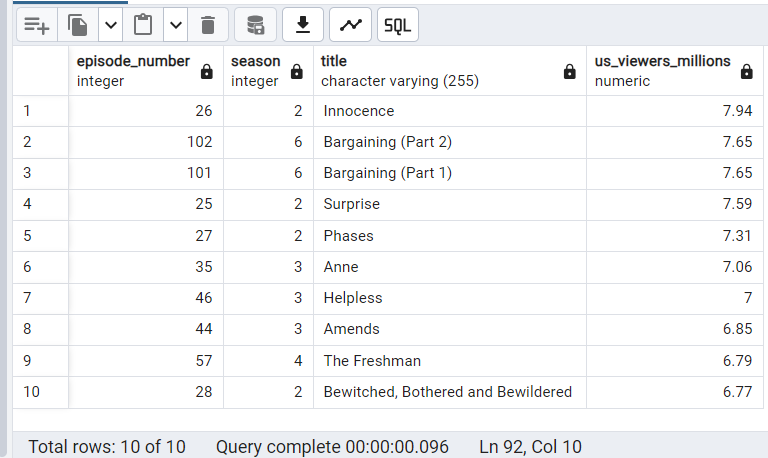
Question 6: Find the top 10 most watched episodes
This SQL query identifies and lists the ten most-watched episodes of “Buffy the Vampire Slayer” based on their U.S. viewership numbers. It ranks episodes by the number of viewers in millions, showcasing the series’ peak popularity moments.
SELECT
  e.no_overall as episode_number,
	e.season,
	e.title,
	r.viewers as us_viewers_millions
FROM sunnydale.episodes e
INNER JOIN sunnydale.ratings r ON e.episodeid = r.episodeid
ORDER BY r.viewers DESC
LIMIT 10;
Explanation:
SELECT: Specifies the columns to be returned in the result set.FROM: Specifies the tables to be joined:sunnydale.episodes e: The episodes table from the sunnydale schema, aliased as e.sunnydale.ratings r: The ratings table from the sunnydale schema, aliased as r.INNER JOIN: Joins theepisodesandratingstables based on theepisodeidcolumn. This ensures that only episodes with corresponding ratings are included in the result.ORDER BY: Sorts the results in descending order based on the viewers column from the ratings table.LIMIT:Restricts the result set to the top 10 episodes with the highest viewer counts.
Result
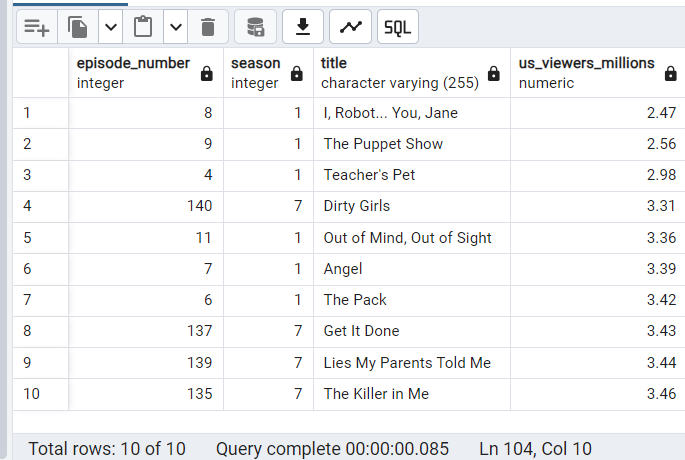
Question 7: Find the top 10 least watched episodes
This SQL query identifies and lists the ten least-watched episodes of “Buffy the Vampire Slayer” based on U.S. viewership figures. It ranks episodes by their viewer count in millions, from lowest to highest.
SELECT
  e.no_overall as episode_number,
	e.season,
	e.title,
	r.viewers as us_viewers_millions
FROM sunnydale.episodes e
INNER JOIN sunnydale.ratings r ON e.episodeid = r.episodeid
ORDER BY r.viewers ASC
LIMIT 10;
Explanation:
SELECT: Specifies the columns to be returned in the result set.FROM: Specifies the tables to be joined:sunnydale.episodes e: The episodes table from the sunnydale schema, aliased as e.sunnydale.ratings r: The ratings table from the sunnydale schema, aliased as r.INNER JOIN: Joins theepisodesandratingstables based on theepisodeidcolumn. This ensures that only episodes with corresponding ratings are included in the result.ORDER BY: Sorts the results in ascending order based on the viewers column from the ratings table.LIMIT:Restricts the result set to the top 10 episodes with the lowest viewer counts.
Result
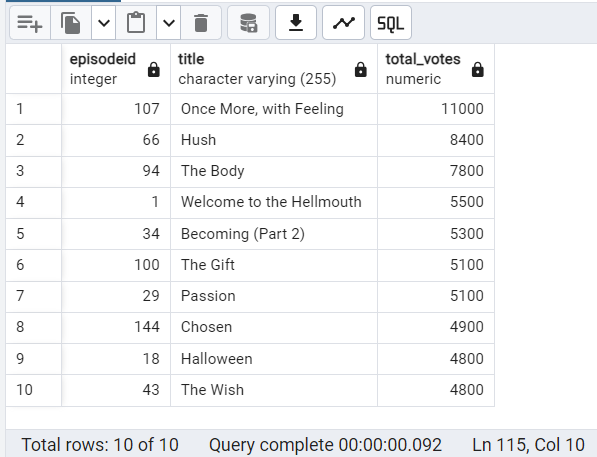
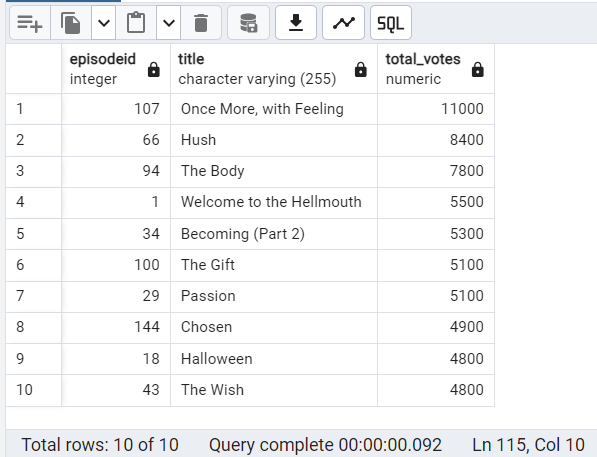
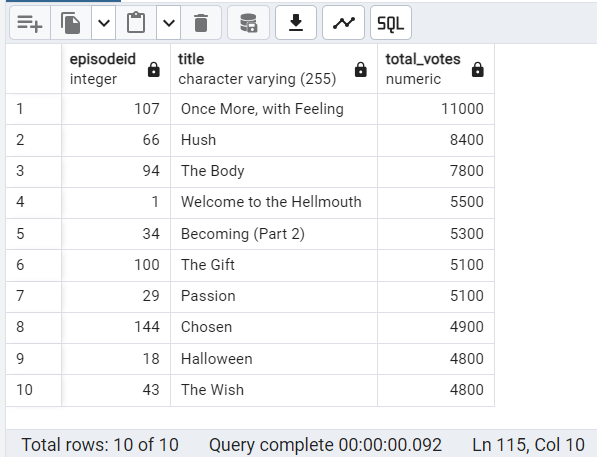
Question 8: Find the top 10 episodes with the most votes
This SQL query determines the total number of votes each episode of “Buffy the Vampire Slayer” received on IMDb. It then ranks these episodes based on their vote count and selects the top ten most-voted episodes. The results indicate which episodes generated the most engagement or discussion among IMDb users, regardless of their actual ratings.
SELECT
    e.episodeid,
    e.title,
    r.imdb_votes AS total_votes
FROM sunnydale.episodes e
INNER JOIN sunnydale.ratings r ON e.episodeid = r.episodeid
ORDER BY total_votes DESC
LIMIT 10;
Explanation:
JOIN: Joins theepisodesandratingstables to get episode details and vote counts.ORDER BY: Orders the results bytotal_votesin descending order to find the top 10 episodes with the most votes.
Result
Key Findings:
- Popularity: “Once More, with Feeling” received the most votes, followed by “Hush” and “The Body.”
- Engagement: The fact that these episodes received a significant number of votes suggests that viewers are actively involved in the show and feel passionate about expressing their opinions.
- Variety of Popular Episodes: The top 10 episodes span multiple seasons, indicating that the show has maintained a consistent level of engagement throughout its run.
Part II: Season Analysis
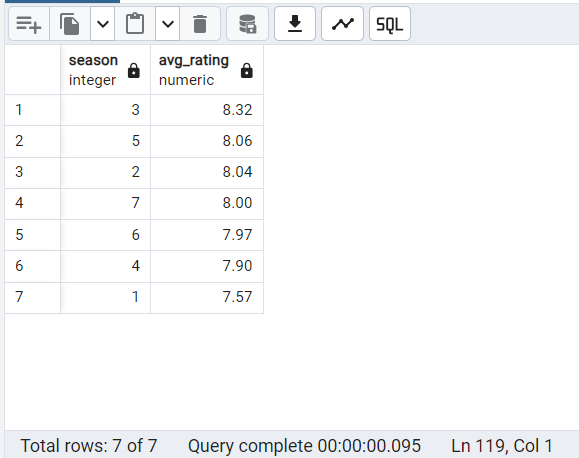
Question 1: Calculate the average rating for each season:
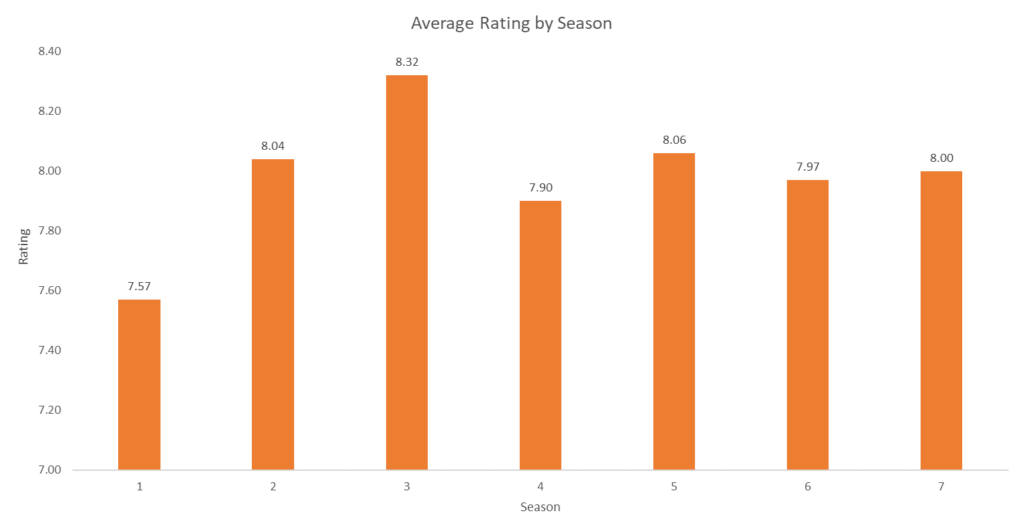
This SQL query calculates the average IMDb rating for each season of “Buffy the Vampire Slayer”. It then ranks the seasons based on these average ratings to identify the most popular ones. The results highlight which seasons were most popular or appreciated by IMDb users.
SELECT
    e.season,
    ROUND(AVG(r.imdb_rating),2) as avg_rating
FROM sunnydale.episodes e
INNER JOIN sunnydale.ratings r ON e.episodeid = r.episodeid
GROUP BY e.season
ORDER BY avg_rating DESC;
Explanation:
INNER JOIN: Joins the episodes and ratings tables based on theepisodeidcolumn so that only episodes with corresponding ratings are included in the result.GROUP BY: Groups the results by season to calculate the average rating for each season.ORDER BY: Sorts the results in descending order based on the calculatedavg_ratingto display the seasons with the highest average ratings first.ROUND(AVG(r.imdb_rating),2) as avg_rating:Calculates the average IMDb rating for the season, rounds it to two decimal places, and assigns it to the aliasavg_rating.
Result
Question 2: Identify the most watched seasons, in terms of average viewership
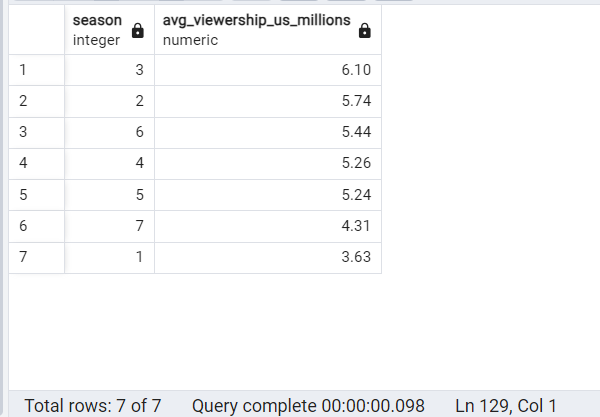
This SQL query calculates the average U.S. viewership for each season of “Buffy the Vampire Slayer”. It ranks seasons based on their average viewer count, providing insight into the show’s popularity trends across its run.
SELECT
  e.season,
	ROUND(AVG(r.viewers),2) AS avg_viewership_us_millions
FROM sunnydale.episodes e
INNER JOIN sunnydale.ratings r ON e.episodeid = r.episodeid
GROUP BY e.season
ORDER BY avg_viewership_us_millions DESC;
Explanation:
ROUND(AVG(r.viewers),2) AS avg_viewership_us_millions: Calculates the average viewership for each season, rounds it to two decimal places, and assigns it to the aliasavg_viewership_us_millions.GROUP BY: Groups the results bye.seasonto calculate the average viewership for each season.ORDER BY:Orders the results in descending order based onavg_viewership_us_millionsto display the seasons with the highest average viewership first.
Result
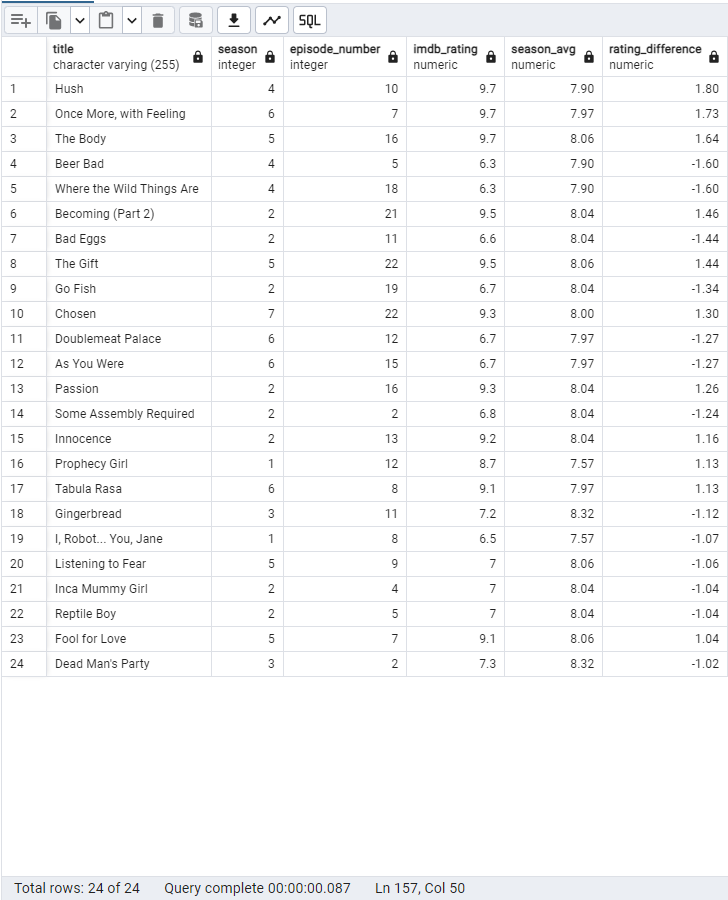
Question 3: Identify episodes with ratings significantly above or below the season average
This SQL query identifies episodes with IMDb ratings that significantly deviate from their respective season averages. These episodes can be considered statistical outliers, either exceptionally well-received or poorly rated compared to the typical episode in that season. The results identify particularly memorable or controversial episodes that stood out from the season’s overall quality trend.
WITH season_avgs AS (
    SELECT e.season, ROUND(AVG(r.imdb_rating),2) as season_avg
    FROM sunnydale.episodes e
	INNER JOIN sunnydale.ratings r ON e.episodeid = r.episodeid
    GROUP BY season
	ORDER BY season
)
SELECT
	e.title,
	e.season,
	e.episode_number,
	r.imdb_rating,
	sa.season_avg,
	ROUND((r.imdb_rating - sa.season_avg),2) AS rating_difference
FROM sunnydale.episodes e
INNER JOIN season_avgs sa ON e.season = sa.season
INNER JOIN sunnydale.ratings r ON e.episodeid = r.episodeid
WHERE ABS(r.imdb_rating - sa.season_avg) > 1
ORDER BY ABS(r.imdb_rating - sa.season_avg) DESC;
Explanation:
- Common Table Expression (CTE):
season_avgs- Calculates the average IMDb rating for each season and stores the results in a temporary table named
season_avgs. SELECT e.season, ROUND(AVG(r.imdb_rating),2) as season_avg: Calculates the average IMDb rating for each season.FROM sunnydale.episodes e: Specifies theepisodestable.INNER JOIN sunnydale.ratings r ON e.episodeid = r.episodeid: Joins theepisodesandratingstables.GROUP BY season: Groups the results by season.ORDER BY season: Orders the results by season.
- Calculates the average IMDb rating for each season and stores the results in a temporary table named
- Main Query
- Joins the
episodestable with theseason_avgsCTE and theratingstable. - Calculates the difference between the individual episode’s IMDb rating and the average rating for its season.
- Filters the results to include only episodes where the absolute difference is greater than 1 (indicating an outlier).
- Orders the results by the absolute difference in descending order to identify the most significant outliers.
- Joins the
Result
Top Outliers:
- “Hush” (Season 4, Episode 10): The most significant outlier, with an IMDb rating of 9.7, which is 1.8 points higher than the season average.
- “Once More, with Feeling” (Season 6, Episode 7): Another top outlier with a 9.7 rating.
- “The Body” (Season 5, Episode 16): Also has a 9.7 rating and stands out as an outlier.
- “Becoming (Part 2)” (Season 2, Episode 22): Has a 9.5 rating, but still stands out as an outlier due to its significant deviation from the season average.
Bottom Outliers:
- “Beer Bad” (Season 4, Episode 5): The most significant outlier on the lower end, with a 6.3 rating, 1.6 points below the season average.
- “Where the Wild Things Are…” (Season 4, Episode 18): Also has a 6.3 rating.
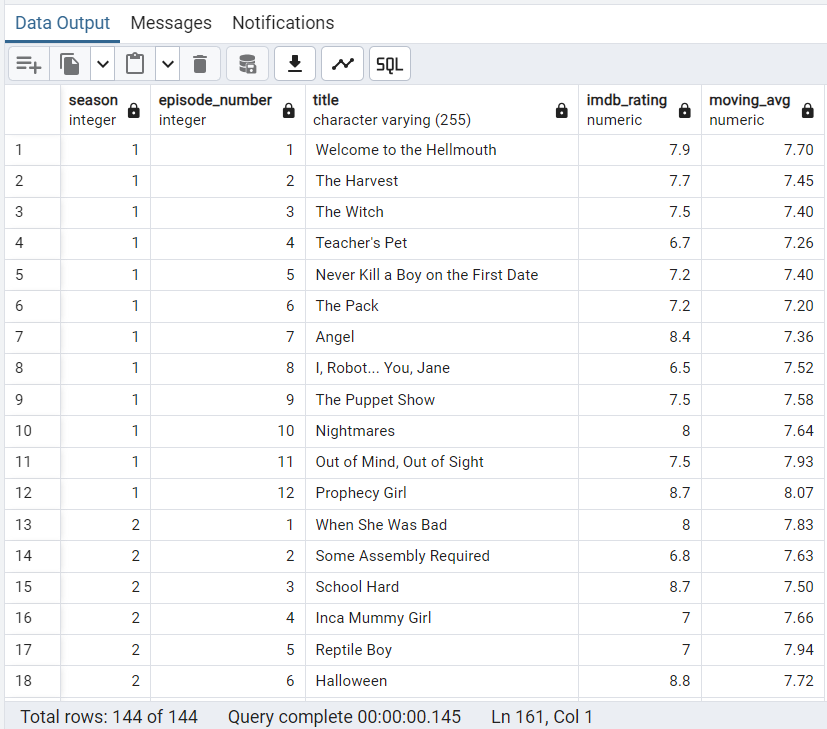
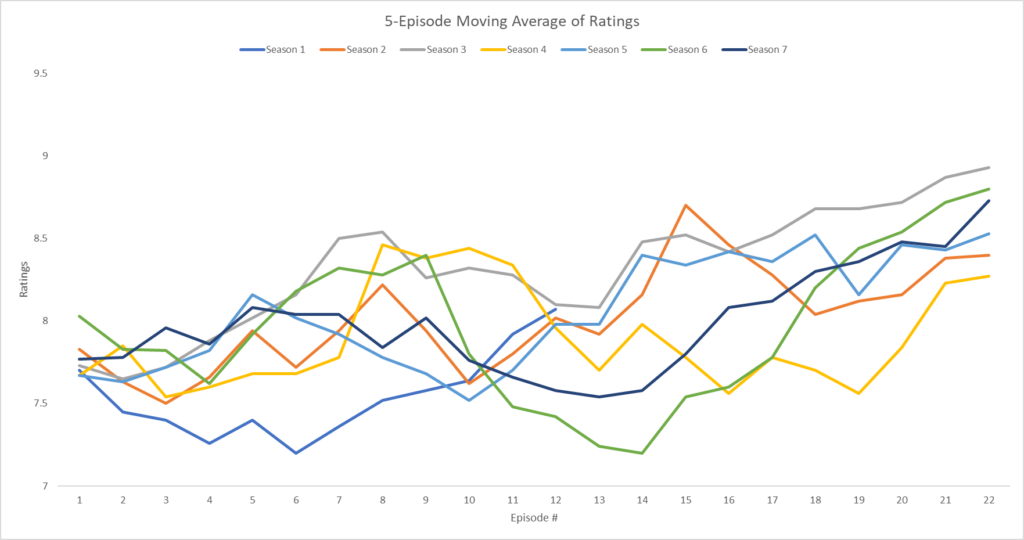
Question 4: Calculate the moving average of ratings over a 5-episode window
This SQL query calculates a moving average of IMDb ratings for “Buffy the Vampire Slayer” episodes, using a five-episode window centered on each episode. It considers the ratings of the current episode, two preceding episodes, and two following episodes to smooth out short-term fluctuations.
The results help identify trends in episode quality over time, highlighting periods of consistent performance or significant deviations from the local average.
SELECT
	e.season,
	e.episode_number,
	e.title,
	r.imdb_rating,
	ROUND(AVG(imdb_rating) OVER (PARTITION BY e.season ORDER BY e.season, e.episode_number ROWS BETWEEN 2 PRECEDING AND 2 FOLLOWING),2) as moving_avg
FROM sunnydale.episodes e
INNER JOIN sunnydale.ratings r ON e.episodeid = r.episodeid
ORDER BY e.season, e.episode_number;
Explanation of the AVG(imdb_rating) OVER (...) Window Function:
PARTITION BY: Partitions the data by season, so the moving average is calculated separately for each season.ORDER BY: Orders the data within each partition by season and episode number to ensure the correct calculation of the moving average.ROWS BETWEEN 2 PRECEDING AND 2 FOLLOWING: Defines the window frame for the moving average, including the current row and the two rows before and after it.
Putting It All Together
ROUND(AVG(imdb_rating) OVER (PARTITION BY e.season ORDER BY e.season, e.episode_number ROWS BETWEEN 2 PRECEDING AND 2 FOLLOWING),2) as moving_avg: Calculates the moving average of IMDb ratings for each episode, considering the ratings of the current episode and the two preceding and two following episodes.
Result
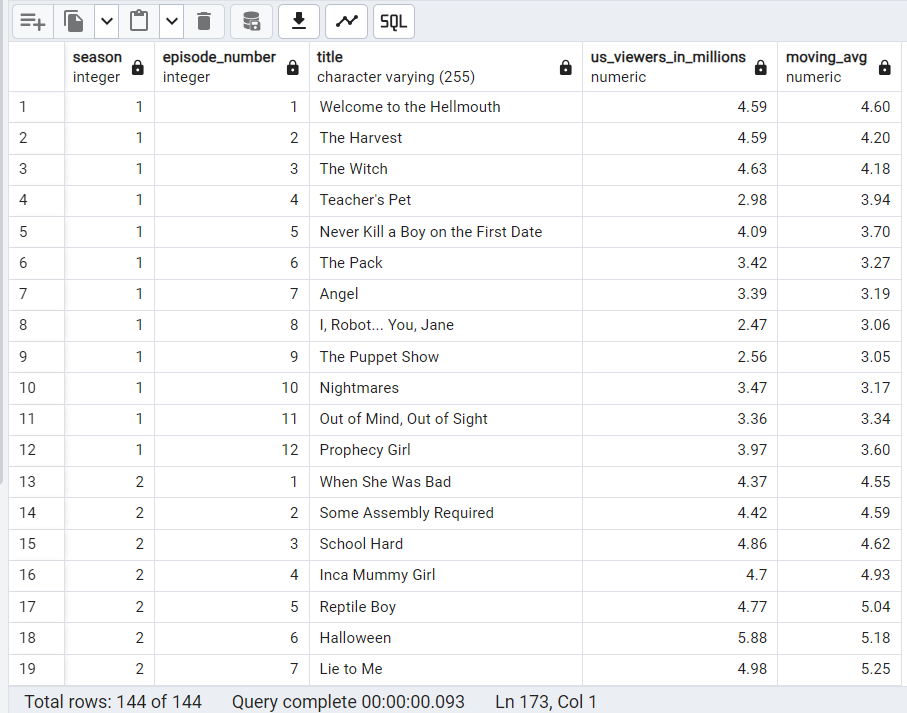
Question 5: Calculate the moving average of U.S. viewership (in millions) over a 5-episode window
This SQL query calculates a moving average of U.S. viewership for episodes of “Buffy the Vampire Slayer,” , using a five-episode window centered on each episode. It considers the viewership of the current episode, two preceding episodes, and two following episodes to smooth out short-term fluctuations.
This analysis helps to identify trends in audience engagement over time, highlighting periods of consistent viewership or significant changes in the show’s popularity.
SELECT
	e.season,
	e.episode_number,
	e.title,
	r.viewers AS us_viewers_in_millions,
	ROUND(AVG(r.viewers) OVER (PARTITION BY e.season ORDER BY e.season, e.episode_number ROWS BETWEEN 2 PRECEDING AND 2 FOLLOWING),2) as moving_avg
FROM sunnydale.episodes e
INNER JOIN sunnydale.ratings r ON e.episodeid = r.episodeid
ORDER BY e.season, e.episode_number;
Explanation of the AVG(r.viewers) OVER (...) Window Function:
PARTITION BY: Partitions the data by season, so the moving average is calculated separately for each season.ORDER BY: Orders the data within each partition by season and episode number to ensure the correct calculation of the moving average.ROWS BETWEEN 2 PRECEDING AND 2 FOLLOWING: Defines the window frame for the moving average, including the current row and the two rows before and after it.
Putting It All Together
ROUND(AVG(r.viewers) OVER (PARTITION BY e.season ORDER BY e.season, e.episode_number ROWS BETWEEN 2 PRECEDING AND 2 FOLLOWING),2) as moving_avg: Calculates the moving average of viewership for each episode, considering the viewership of the current episode and the two preceding and two following episodes.
Result
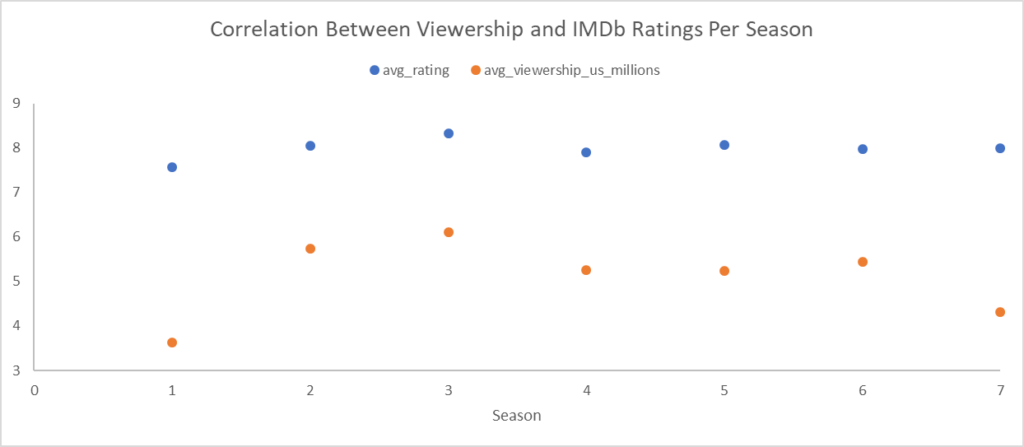
Question 6: Calculate Correlation Between Viewership and IMDb Ratings for each season
This SQL query calculates the correlation coefficient to assess the association between viewership and IMDb ratings across different seasons of “Buffy the Vampire Slayer.” By analyzing this correlation, it aims to uncover patterns suggesting whether episodes that are more popular with viewers tend to receive higher ratings on IMDb.
This provides insights into whether there’s a relationship between the popularity of an episode (measured by viewership) and its critical reception (measured by IMDb rating).
SELECT DISTINCT
    e.season,
    ROUND(AVG(r.imdb_rating) OVER (PARTITION BY e.season), 2) as avg_rating,
    ROUND(AVG(r.viewers) OVER (PARTITION BY e.season), 2) AS avg_viewership_us_millions,
    ROUND(CORR(r.imdb_rating, r.viewers) OVER (PARTITION BY e.season)::numeric, 2) AS episode_rating_correlation
FROM sunnydale.episodes e
INNER JOIN sunnydale.ratings r ON e.episodeid = r.episodeid
ORDER BY e.season;
Explanation of Key Parts:
Window Functions:
AVG(r.imdb_rating) OVER (PARTITION BY e.season):Calculates the average IMDb rating for each season.AVG(r.viewers) OVER (PARTITION BY e.season): Calculates the average viewership for each season.CORR(r.imdb_rating, r.viewers) OVER (PARTITION BY e.season): Calculates the correlation between IMDb ratings and viewership for each season.- The
CORRfunction calculates the Pearson (linear) correlation coefficient, which measures the linear relationship between two variables. This will give a value between -1 and 1.
- The
Type Casting and Rounding:
::numeric:Explicitly casts the correlation coefficient to numeric for better precision and to allow for rounding.ROUND(CORR(r.imdb_rating, r.viewers) OVER (PARTITION BY e.season)::numeric, 2) AS episode_rating_correlation: Calculates the the Pearson correlation coefficient for each season, rounded to two decimal places.
Result
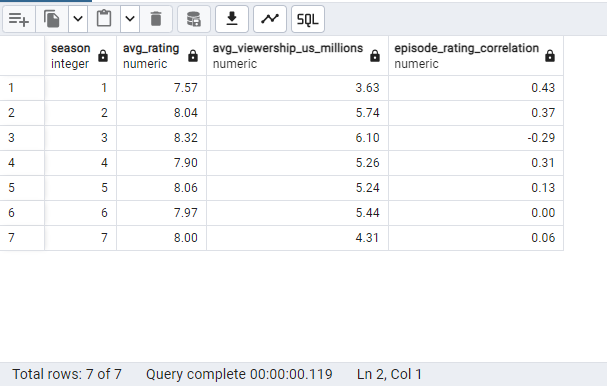
Key Findings
- Ratings Trend:
- Highest rated season: Season 3 (8.32)
- Lowest rated season: Season 1 (7.57)
- Overall, ratings are consistently high, ranging from 7.57 to 8.32
- Viewership Trend:
- Highest viewership: Season 3 (6.10 million)
- Lowest viewership: Season 7 (4.31 million)
- Viewership peaked in early seasons and generally declined in later seasons
- Rating-Viewership Correlation:
- Strongest positive correlation: Season 1 (0.43)
- Strongest negative correlation: Season 3 (-0.29)
- In general, there is no strong correlation between ratings and viewership. While there’s a general trend of higher ratings correlating with higher viewership in some seasons, the relationship is not consistently strong.
- Factors other than IMDb ratings may influence viewership, such as marketing, time slots, competition, or cultural trends.
Correlation (Explanation):
CORR(...): Calculates the Pearson correlation coefficient between the two calculated averages. This will give a value between -1 and 1.- A value closer to 1 indicates a strong positive correlation (higher ratings correlate with higher viewership).
- A value closer to -1 indicates a strong negative correlation (higher ratings correlate with lower viewership).
- A value closer to 0 indicates no correlation.
Question 7: Compare ratings of season premieres and finales
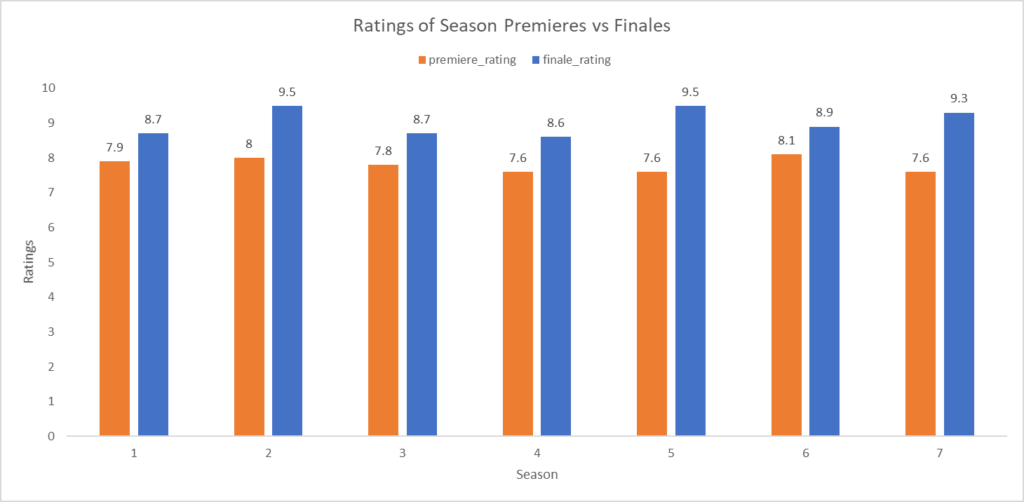
This query calculates the IMDb ratings for both the premiere and finale episodes of each season in the “Buffy the Vampire Slayer” dataset. It provides an insight into the performance of the show’s opening and closing episodes. By focusing on these key episodes, it helps assess how the show’s season openers and closers performed in terms of audience reception. This offers insight into whether the show maintained or built excitement across each season’s narrative arc.
WITH last_episodes AS (
    SELECT
        season,
        MAX(episode_number) AS last_episode
    FROM sunnydale.episodes
    GROUP BY season
)
SELECT
    e.season,
    MAX(CASE WHEN e.episode_number = 1 THEN r.imdb_rating END) AS premiere_rating,
    MAX(CASE WHEN e.episode_number = le.last_episode THEN r.imdb_rating END) AS finale_rating
FROM sunnydale.episodes e
INNER JOIN sunnydale.ratings r ON e.episodeid = r.episodeid
INNER JOIN last_episodes le ON e.season = le.season
GROUP BY e.season
ORDER BY e.season;
Explanation of Key Parts:
Common Table Expression (CTE): last_episodes
- This CTE identifies the last episode number for each season.
SELECT season, MAX(episode_number) AS last_episode FROM sunnydale.episodes GROUP BY season: Calculates the maximum episode number for each season, which is the last episode for each season (season finale).
Main Query
- Joins the
episodes,ratings, andlast_episodestables. - Uses
CASEexpressions to determine the premiere and finale ratings based on the episode number and thelast_episodevalues from the CTE. - Groups the results by season and orders them by season.
Putting It All Together
- CTE: The CTE is used to calculate the last episode number for each season before joining with the other tables.
- CASE Expressions: The
CASEexpressions are used to conditionally extract the IMDb rating for the first and last episodes of each season. - Joins: The
INNER JOINs are used to combine data from theepisodes,ratings, andlast_episodestables.
Result
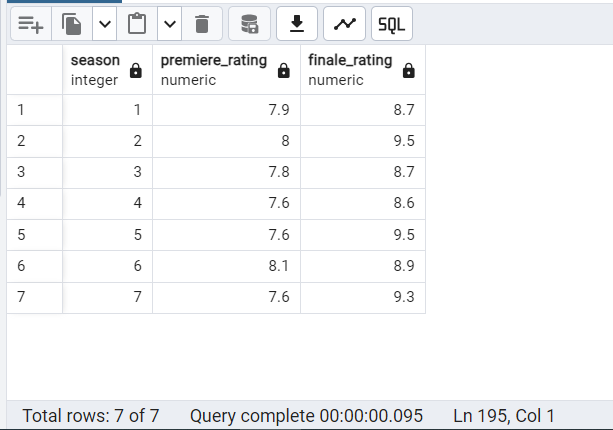
- Observations:
- Season 1: Started with a 7.9 rating and ended stronger with an 8.7.
- Season 2: Had the highest finale rating of 9.5, indicating a very well-received season finale.
- Season 3: Started with 7.8 and ended with a season finale at 8.7.
- Seasons 4-7: Generally had lower premiere ratings (around 7.6) but stronger finales.
- Season 6: Had the highest premiere rating of 8.1.
- Seasons 2 and 5 tied for the highest finale rating of 9.5.
- The series finale – season 7 – also had the third highest finale rating of 9.3, indicating that fans were generally satisfied with the conclusion of the show.
- Trends:
- In most seasons, the finale rating is higher than the premiere rating, suggesting the show often ended seasons on a high note.
- The premiere ratings fluctuate between 7.6 and 8.1, while finale ratings have a wider range from 8.6 to 9.5.
Question 8: Identify the highest-rated episodes of each season
This SQL query identifies the highest-rated episode(s) of each season in “Buffy the Vampire Slayer,” returning the season, episode ID, title, and IMDb rating. If multiple episodes share the top rating in a season, they are all included in the results. This analysis highlights standout episodes in terms of critical acclaim, identifying the episodes that resonated most with viewers each season.
WITH highest_rated_episodes AS (
    SELECT
        e.season,
        e.episodeid,
				e.title,
        r.imdb_rating
    FROM sunnydale.episodes e
    INNER JOIN sunnydale.ratings r ON e.episodeid = r.episodeid
    ORDER BY e.season, r.imdb_rating DESC
)
SELECT
    hre.season,
    hre.episodeid,
		hre.title,
    hre.imdb_rating
FROM highest_rated_episodes hre
INNER JOIN (
    SELECT season, MAX(imdb_rating) AS max_rating
    FROM highest_rated_episodes
    GROUP BY season
) hre2 ON hre.season = hre2.season AND hre.imdb_rating = hre2.max_rating;
Explanation:
- Common Table Expression (CTE):
highest_rated_episodes- This CTE ranks episodes within each season by IMDb rating in descending order.
- Main Query
- Joins the
highest_rated_episodesCTE with a subquery that finds the maximum IMDb rating for each season. - This ensures that only the highest-rated episode(s) for each season are selected.
- Joins the
Result
Part III: Production Analysis
Question 1: Compare the average ratings of episodes written by Joss Whedon vs. other writers:
This SQL query compares the average IMDb rating for episodes written by Joss Whedon, the creator and showrunner of “Buffy the Vampire Slayer,” with those written by other writers. By calculating these averages, it offers insight into how episodes written by Whedon are rated in comparison to those written by other contributors. This analysis helps evaluate whether Whedon’s episodes consistently received higher ratings from viewers.
SELECT
    CASE
		WHEN w.writer_name = 'Joss Whedon' THEN 'Joss Whedon'
		ELSE 'Other Writers'
	END as writer_group,
	ROUND(AVG(r.imdb_rating),2) as avg_rating
FROM sunnydale.episodes e
INNER JOIN sunnydale.writers_episodes we ON e.episodeid = we.episodeid
INNER JOIN sunnydale.writers w ON w.writerid = we.writerid
INNER JOIN sunnydale.ratings r ON e.episodeid = r.episodeid
GROUP BY writer_group;
Explanation:
CASE WHEN w.writer_name = 'Joss Whedon' THEN 'Joss Whedon' ELSE 'Other Writers' END as writer_group: Creates a new column calledwriter_groupthat categorizes episodes as either written by Joss Whedon or by other writers.ROUND(AVG(r.imdb_rating),2) as avg_rating: Calculates the average IMDb rating for each writer group, rounds it to two decimal places, and assigns it to the aliasavg_rating.INNER JOIN:Joins theepisodes,writers_episodes,writers, andratingstables based on their respective foreign key relationships.GROUP BY:Groups the results bywriter_groupto calculate the average rating for each writer category.
Result
Key Findings:
- Episodes written by Joss Whedon have a significantly higher average IMDb rating of 8.58, compared to 7.83 for episodes written by other writers.
- It appears that episodes written by Joss Whedon tend to be rated more highly by viewers than those written by other writers.
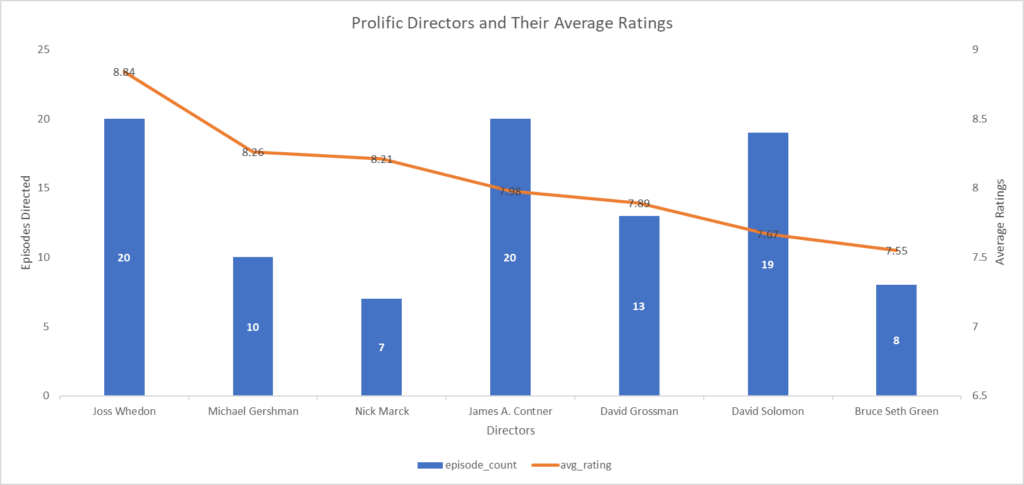
Question 2: Identify the most common episode directors and their average episode ratings
This query provides a summary of the performance of directors who have directed more than 5 episodes of “Buffy the Vampire Slayer”, focusing on their episode count and IMDb ratings.
By filtering for directors with significant involvement, the query helps identify those who have consistently directed high-quality episodes.
This analysis highlights the directors who contributed the most critically acclaimed work to the series across multiple episodes.
SELECT
	director,
	COUNT(*) as episode_count,
	ROUND(AVG(r.imdb_rating),2) as avg_rating
FROM sunnydale.episodes e
INNER JOIN sunnydale.ratings r ON e.episodeid = r.episodeid
GROUP BY director
HAVING COUNT(*) > 5
ORDER BY avg_rating DESC;
Explanation
COUNT(*) as episode_count: Counts the number of episodes directed by each director.ROUND(AVG(r.imdb_rating),2) as avg_rating: Calculates the average IMDb rating for episodes directed by each director.GROUP BY: Groups the results by director to calculate the average rating and episode count for each director.HAVING COUNT(*) > 5: Filters the results to include only directors who have directed more than 5 episodes.ORDER BY avg_rating DESC: Orders the results in descending order based on the average rating.
Result
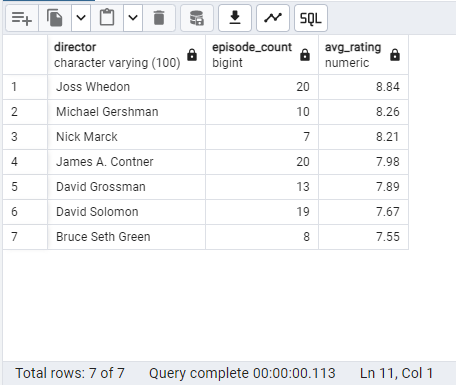
Key Findings:
- Joss Whedon is the top-rated director with an average IMDb rating of 8.84 and 20 episodes directed.
- Michael Gershman and Nick Marck also have high average ratings and have directed a significant number of episodes.
- The average IMDb ratings for most directors are relatively high, indicating that the show generally maintains a consistent level of quality.
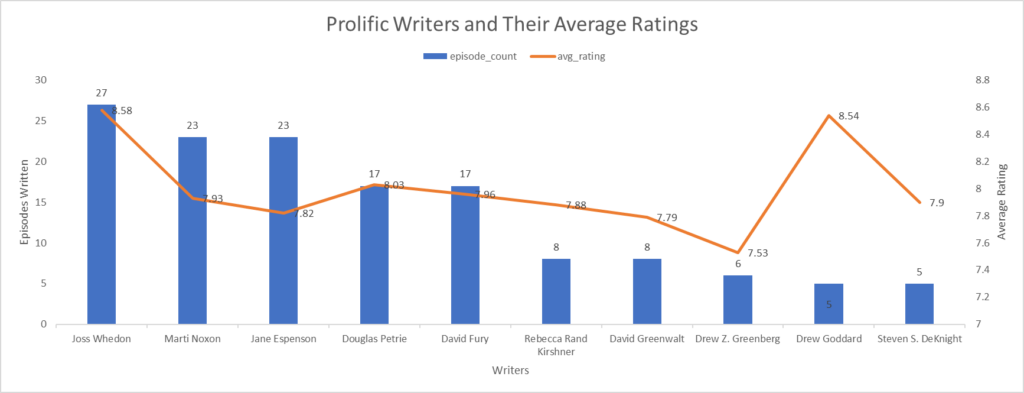
Question 3: Identify Top 10 most prolific writers and their average episode ratings
This SQL query identifies the names of the top 10 most prolific writers, along with the number of episodes they’ve written, and their average IMDb rating. It allows us to assess the quality and impact of the most frequent contributors to the show’s writing.
SELECT
    w.writer_name,
    COUNT(*) AS episode_count,
    ROUND(AVG(r.imdb_rating), 2) AS avg_rating
FROM sunnydale.episodes e
INNER JOIN sunnydale.writers_episodes we ON e.episodeid = we.episodeid
INNER JOIN sunnydale.writers w ON w.writerid = we.writerid
INNER JOIN sunnydale.ratings r ON e.episodeid = r.episodeid
GROUP BY w.writer_name
ORDER BY episode_count DESC, avg_rating DESC
LIMIT 10;
Explanation:
JOIN: Joins theepisodes,writers_episodes,writers, andratingstables to get information about episodes, writers, and their ratings.GROUP BYandAGGREGATION: Groups the results bywriter_nameto calculate the number of episodes written by each writer and their average IMDb rating.ORDER BY: Orders the results by the number of episodes written (descending) and then by average rating (descending) to identify the most prolific writers and their performance.
Result
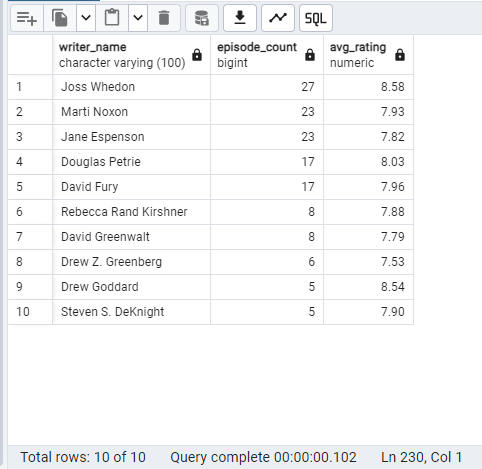
Key Findings:
Prolific Writers:
- Joss Whedon is the most prolific writer, having written 27 episodes. Marti Noxon and Jane Espenson have also written a significant number of episodes.
Top-Rated Writers:
- Joss Whedon has the highest average IMDb rating of 8.58, indicating that his episodes are generally well-received.
- Other writers, such as Drew Goddard, Douglas Petrie, David Fury, and also have high average ratings. Drew Goddard in particular only wrote 5 episodes, but has the second highest average rating of 8.54, second only to Joss Whedon.
Consistent Quality:
- While the number of episodes written varies, many writers have maintained a consistent level of quality, as evidenced by their average IMDb ratings.
Conclusion:
- Joss Whedon is the most prolific and highly-rated writer. However, other writers, such as Marti Noxon, Jane Espenson, Drew Goddard, and Douglas Petrie, have also made significant contributions to the show’s quality. The show has benefited from a strong team of writers.
Question 4: Find Episodes Written by Drew Goddard
This SQL query retrieves the season, episode number, and title of all episodes written by Drew Goddard for “Buffy the Vampire Slayer.” Goddard holds the second highest average IMDb episode rating of 8.54, just below Joss Whedon’s 8.58.
SELECT
    e.season,
    e.episode_number,
    e.title
FROM sunnydale.episodes e
INNER JOIN sunnydale.writers_episodes we ON e.episodeid = we.episodeid
INNER JOIN sunnydale.writers w ON w.writerid = we.writerid
WHERE w.writer_name = 'Drew Goddard';
Explanation:
- Joins: Joins the
episodes,writers_episodes, andwriterstables to get information about episodes and their corresponding writers. - Filtering: Filters the results based on the condition
w.writer_name = 'Drew Goddard', selecting only episodes written by Drew Goddard.
Result
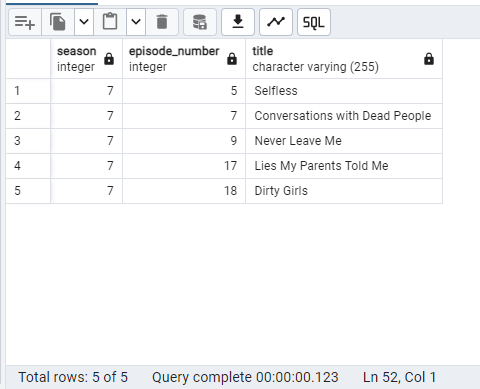
Part IV: Complex Queries
Question 1: Villain effect: Which “Big Bad” correlated with the highest average episode ratings for their respective season?
This query will include the season, main villain (”big bad”), overall average rating, season average rating, minimum rating, maximum rating, episode count, and z-score for each season and big bad combination.
The z-score measures how far a season’s average rating deviates from the overall average, with higher z-scores indicating seasons that performed significantly better than others.
This analysis helps assess which seasons and villains contributed most to the show’s critical success by comparing each season’s performance to the series average.
WITH big_bads AS (
    SELECT 1 AS season_number, 'The Master' AS big_bad UNION ALL
    SELECT 2, 'Spike and Drusilla' UNION ALL
    SELECT 3, 'Mayor Richard Wilkins' UNION ALL
    SELECT 4, 'Adam' UNION ALL
    SELECT 5, 'Glory' UNION ALL
    SELECT 6, 'The Trio / Dark Willow' UNION ALL
    SELECT 7, 'The First Evil'
),
season_ratings AS (
    SELECT
        e.season,
        bb.big_bad,
        ROUND (AVG(r.imdb_rating),2) AS avg_rating,
        ROUND (MIN(r.imdb_rating),2) AS min_rating,
        ROUND (MAX(r.imdb_rating),2) AS max_rating,
        COUNT(*) AS episode_count
    FROM
        sunnydale.episodes e
    INNER JOIN sunnydale.ratings r ON e.episodeid = r.episodeid
    INNER JOIN big_bads bb ON e.season = bb.season_number
    GROUP BY
        e.season, bb.big_bad
),
overall_stats AS (
    SELECT
        ROUND(AVG(r.imdb_rating),2) AS overall_avg_rating,
        ROUND(STDDEV_SAMP(r.imdb_rating),2) AS rating_stddev
    FROM sunnydale.ratings r
)
SELECT
    sr.season,
    sr.big_bad,
		ROUND(os.overall_avg_rating,2) AS overall_avg_rating,
    ROUND(sr.avg_rating, 2) AS avg_rating,
    ROUND(sr.min_rating, 2) AS min_rating,
    ROUND(sr.max_rating, 2) AS max_rating,
    sr.episode_count,
		ROUND((sr.avg_rating - os.overall_avg_rating) / os.rating_stddev, 2) AS z_score
FROM
    season_ratings sr
CROSS JOIN
    overall_stats os
ORDER BY
    sr.avg_rating DESC;
Explanation
- Common Table Expression (CTE):
big_bads- Defines the main villains (”big bads”) for each season.
- CTE:
season_ratings- Calculates the average, minimum, maximum IMDb ratings, and episode count for each season and big bad combination.
- CTE:
overall_stats- Calculates the overall average and standard deviation of IMDb ratings.
- Main Query
- Joins the
season_ratingsandoverall_statsCTEs to calculate the z-score for each season. - Orders the results by average rating in descending order.
- Joins the
Result

Key Findings:
- Average Ratings:
- Season 3 with Mayor Richard Wilkins has the highest average rating (8.32).
- Season 1 with The Master has the lowest average rating (7.57).
- Z-Scores:
- Season 3 with Mayor Richard Wilkins has the highest z-score (0.42), indicating that its average rating is significantly higher than the overall average.
- Season 7 with The First Evil has the lowest z-score (-0.60), suggesting that its average rating is significantly lower than the overall average.
Conclusion:
While Season 3 with Mayor Richard Wilkins has the highest average rating, it’s important to consider the z-score as well. Its z-score of 0.42 indicates that Season 3’s performance is significantly better than the overall average.
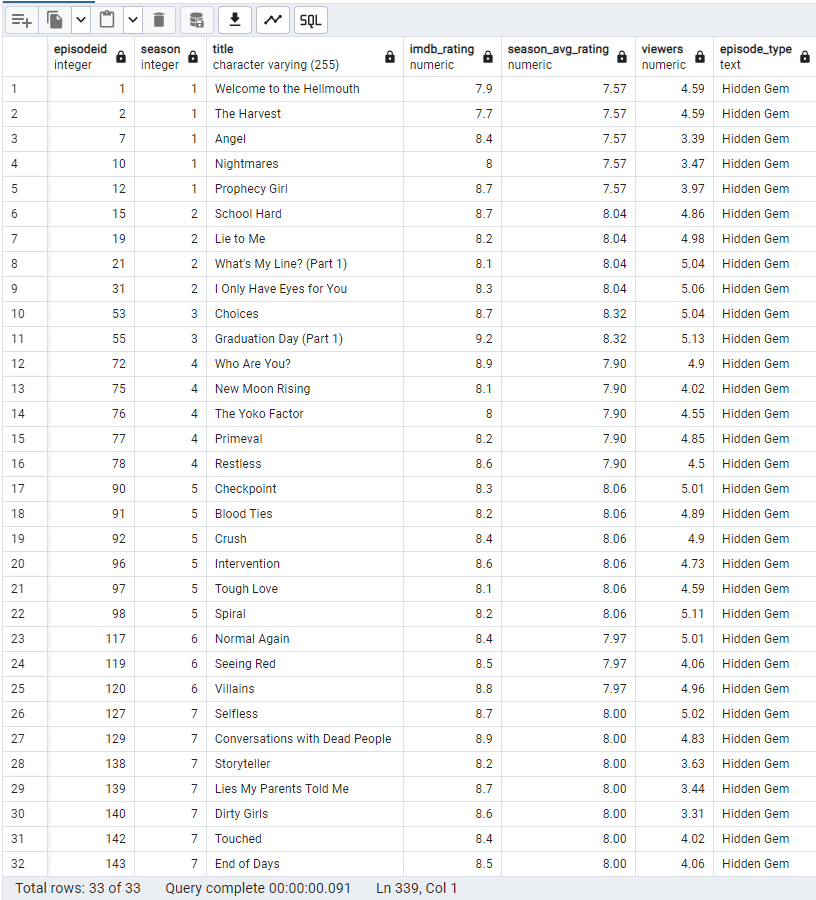
Question 2: Identify Hidden Gems: High-Rated, Low-Viewership Episodes
This SQL query identifies episodes that received high IMDb ratings but had relatively low viewership. By focusing on these episodes, the query highlights high-quality episodes that may have been overlooked or underappreciated by the broader audience.
This analysis helps reveal hidden gems within the series—episodes that were critically acclaimed but didn’t attract large viewer numbers.
WITH episode_stats AS (
    SELECT
        e.episodeid,
        e.season,
        e.title,
        r.imdb_rating AS imdb_rating,
        r.viewers AS viewers,
        ROUND(AVG(r.imdb_rating) OVER (PARTITION BY e.season), 2) AS season_avg_rating
    FROM sunnydale.episodes e
    INNER JOIN sunnydale.ratings r ON e.episodeid = r.episodeid
)
SELECT
    es.episodeid,
    es.season,
    es.title,
    es.imdb_rating,
	es.season_avg_rating,
    es.viewers,
    CASE
        WHEN es.imdb_rating > es.season_avg_rating AND es.viewers < (SELECT AVG(viewers) FROM sunnydale.ratings) THEN 'Hidden Gem'
        ELSE 'Other'
    END AS episode_type
FROM episode_stats es
WHERE es.imdb_rating > es.season_avg_rating AND es.viewers < (SELECT AVG(viewers) FROM sunnydale.ratings);
Explanation:
- Common Table Expression (CTE):
episode_stats- Calculates the average IMDb rating for each season and joins it with the episode data.
- Main Query
- Identifies episodes as “Hidden Gems” if their IMDb rating is higher than the season average and their viewership is lower than the overall average viewership.
- The
WHEREclause ensures that only episodes that meet the criteria for a “Hidden Gem” (higher than season average rating and lower than overall average viewership) are included in the results.episode_stats.imdb_rating > episode_stats.season_avg_rating: Ensures the episode’s rating is higher than the season average.episode_stats.viewers < (SELECT AVG(viewers) FROM sunnydale.ratings): Ensures the episode’s viewership is lower than the overall average viewership.
Result
Key Findings:
33 episodes match the criteria of shows with high user ratings that had low viewership.
Note: Average viewership per episode throughout the show is 5.2 million US viewers
![]()

Visualizing Insights with MS Excel
In order to effectively communicate some key findings of this analysis, I developed some charts and graphs that provide a comprehensive view of the key trends and patterns in the episode data. By transforming raw data into clear visuals, it becomes easier to understand the analysis and insights uncovered in this study.
1.2: Identify the Top 10 Highest Rated Episodes
1.4: Analyze the Distribution of Ratings
2.1: Identify the Average Rating by Season
2.4: Calculate the moving average of ratings over a 5-episode window
2.6: Calculate Correlation Between Viewership and IMDb Ratings for each season
2.7: Compare ratings of Season Premieres and Finales
3.2: Identify the most common episode directors and their average episode ratings
3.3: Identify Top 10 most prolific writers and their average episode ratings
Conclusion
Buffy the Vampire Slayer maintained a consistent level of quality throughout its run, thanks to strong writing, directing, and the contributions of a talented team of creators. The show’s ability to engage viewers and maintain a loyal fanbase is a testament to its enduring appeal.
The show maintained consistently high IMDb ratings throughout its run, with an average rating of 8.01. While viewership declined in later seasons, the show’s quality remained strong, indicating a loyal core audience.
Key Findings:
Overall Ratings and Viewership
- IMDb Ratings: The IMDb ratings range from a minimum of 6.3 to a maximum of 9.7 (out of 10), with an average IMDb rating of 8.01 for all episodes. A majority of episodes fall within the 7-8 range. The show maintained consistently high ratings throughout its run, with all seasons averaging above 7.5.
- Highest rated season: Season 3 (8.32)
- Lowest rated season: Season 1 (7.57)
- Viewership: Viewership peaked in the early seasons (2-3) and showed a general declining trend afterwards.
- Highest Average viewership: Season 3 (6.10m)
- Lowest Average viewership: Season 1 (3.63m).
Season Analysis
- Seasonal Patterns: The show maintained consistently high ratings throughout its run, with all seasons averaging above 7.5. Season 3 had the highest average rating of 8.32/10, closely followed by Season 5 at 8.06/10.
- Season Premieres and Finales: The analysis reveals a pattern of season finales outperforming premieres in terms of ratings, suggesting the show excelled at delivering satisfying conclusions. The premiere ratings fluctuate between 7.6 and 8.1, while finale ratings have a wider range from 8.6 to 9.5.
- The series finale (the very final episode of the show) also had the third highest finale rating of 9.3, indicating that fans were generally satisfied with the conclusion of the show.
Writer and Director Contributions
- Joss Whedon’s Influence: As the creator and a prolific writer for the show, Joss Whedon’s episodes consistently garner high ratings, highlighting his significant impact on the show’s quality. Joss Whedon-written episodes had an average rating of 8.58/10, significantly higher than the series average of 8.01/10, and of the other writers for the show.
- Writer Impact: The analysis also acknowledges the contributions of other talented writers, such as Marti Noxon, Jane Espenson, Drew Goddard, and Douglas Petrie, showcasing the show’s success as a collaborative effort.
- Director Influence: Episodes directed by Joss Whedon had the highest average rating (8.84/10) among directors with more than five episodes. Michael Gershman, who directed 10 episodes, had the second highest average rating of 8.26/10. Nick Marck also contributed significantly to the show’s high production value.
Correlation Between Viewership and IMDb Ratings
- Overall Correlation: While there’s a general trend of higher ratings correlating with higher viewership, the relationship is not consistently strong. In general, there is no strong correlation between user ratings and viewership numbers.
- This suggests that other factors beyond episode quality, such as scheduling and promotion, competition, or even cultural trends, may have influenced viewership independently of episode quality.
Big Bads and Season Performance
- The Power of the “Big Bad”: Examining the correlation between the season’s main villain (“Big Bad”) and ratings revealed that Season 3, featuring Mayor Richard Wilkins, stood out with the highest average rating and a significantly higher z-score compared to other seasons. This suggests that the “Big Bad” significantly impacts a season’s reception.
Acknowledgments
- Data sourced from IMDb and Wikipedia
- Inspired by the work of Joss Whedon and the Buffy the Vampire Slayer creative team
Data Sources
- Ratings: https://www.imdb.com/title/tt0118276/ratings/
- Episodes: https://en.wikipedia.org/wiki/List_of_Buffy_the_Vampire_Slayer_episodes#Ratings
- IMDB Vote Count: https://www.imdb.com/title/tt0118276/episodes/?season=1
GitHub Repo
You can view the project’s data and scripts on GitHub